
Meet the Papercast CMS Layout Catalogue: A must have resource for sharing visually impactful passenger information
We’re excited to tell you about the Papercast Content Management System (CMS) Layout Catalogue, an…

There’s a colossal volume of bus location data captured through Computer Aided Dispatch and Automatic Vehicle Location (CAD/AVL) systems. These systems are now expected as standard for fixed-route transit networks and have allowed for significant advancements in the way we keep passengers informed on services.
The idea is that the data is used to provide real-time estimates to transit riders on bus arrivals and journey times. The same information also helps transport agencies to monitor and improve operational performance.
But scratch below the surface and you will find that all is not perfect. There are limitations, as there can be with everything – depending on your aspirations or indeed the expectations of your customers.
Watch the use case video here:
The problem is that traditional models have questionable accuracy when it comes to estimating bus arrival and journey times. This essentially results from two factors combined: rising congestion as urbanization continues and the lack of integration of emerging technologies.
The challenge is that our roads are becoming increasingly congested and most systems simply cannot factor ‘real-life’ into real-time predictions. This is compounded by the fact that these same systems offer no visibility over the quality the data supplied to the public.
In our experience, real-time data originates from multiple dispersed data sources and is processed by various systems – often ‘bolted on’ over time with varying degrees of integration. Consideration is rarely given to quality of the data being processed, yet this data is used internally for operational planning and decision making, as well as digitally shared with the public to help them to plan their travel.
But how reliable is this data and why does data quality remain unaddressed?
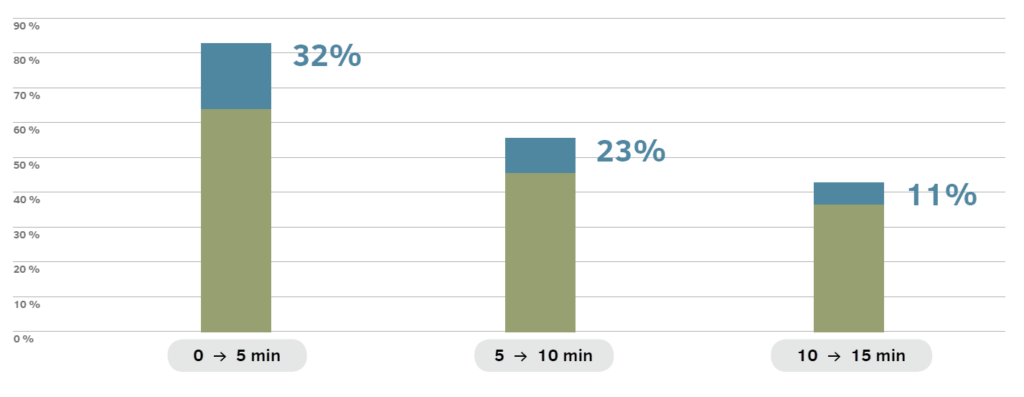
So how bad is it? From our analysis, we know that bus arrival predictions can be as low as 35% accurate 10-15 minutes before the bus is due and 50% accurate in the 5 minutes before arrival.
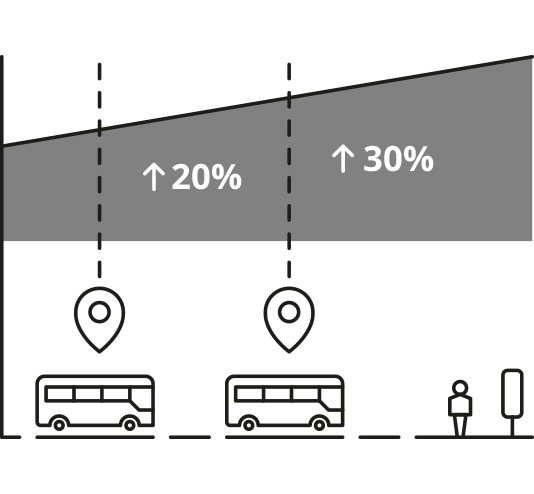 The debate is whether this is acceptable. We don’t think it is and in most cases, the passenger doesn’t either. Passengers just want to get to their destination on time – and if the bus comes just minutes later than their app shows, they’re frustrated.
The world over, there is negative feeling associated with bus reliability which in turn has an impact on overall ridership growth. Get it right – by that, we mean consistently reliable and accurate bus arrival predictions – and you can reap the rewards.
Let’s start with the customer. Estimated bus arrival and travel times have a significant impact on how passengers perceive bus services. Consider these scenarios:
Providing accurate real-time information helps passengers better plan their trips and minimize waiting times, which contributes towards a better customer experience. Passengers are typically interested in bus arrival times at the bus stop and the journey time to their destination. This is confirmed by the recent ‘Digital Bus Innovations Report’ commissioned by Transport for London:

Passengers expect more reliable information that takes into account real-time delays and disruptions. We are confident in our belief that disseminating accurate estimated time of arrival (ETA) data is very important in boosting both satisfaction and adoption of bus services.
Accurate bus arrival data supports decision making that can improve service performance at both the operational and strategic levels.
At an operational level, here are just a few of many examples:
At a strategic level, detailed and accurate audit data also offers insight into future transport trends and challenges, helping operators to proactively implement service changes to meet customer needs as they evolve.
Fast forward to the day when the bus arrives exactly when the mobile app and bus stop states it will, and all your passengers are saying “the bus is always on time, what a great service.
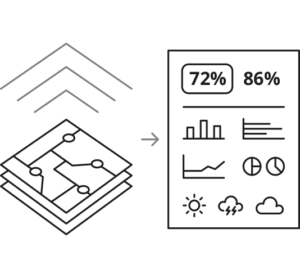
Imagine an advanced analytics platform that takes your existing data feeds from your current CAD/AVL system and calculates the accuracy of existing ETA across the entire network – offering newfound insight into ETA reliability.
The same system then applies big data methods to improve ETA. An advanced statistical engine uses progressive methods and machine learning to process the data and improve predictions in real-time. The result is Better ETA. This is simply integrated into your passenger information system and made available to all channels under open data standards (a bonus if you are currently limited by a proprietary API).
As if that isn’t enough, with advanced analytics and benchmarking, the platform also gives you insight on how to improve service standards so that you can make your ETA even better.
Just like this:
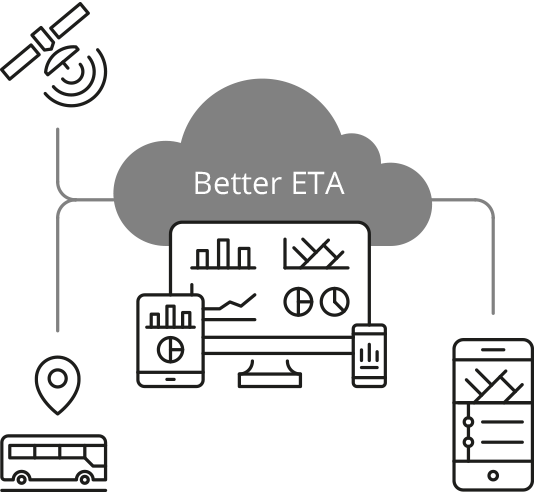
Sounds good? If you are interested in more detail on how the system works, please get in contact with Papercast. But for now, I suggest that you read on to see the extent of what you can achieve with Better ETA.
We integrate public GTFS RT data feeds from cities around the world into our application with comparable outcomes. The example outlined in this section presents the average performance of three cities to demonstrate our case – Denver, Pittsburgh and Melbourne.
Here’s a quick rundown…
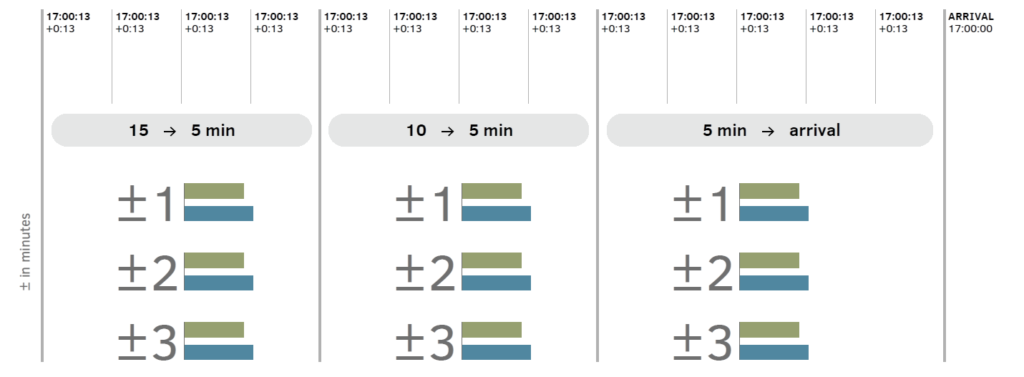
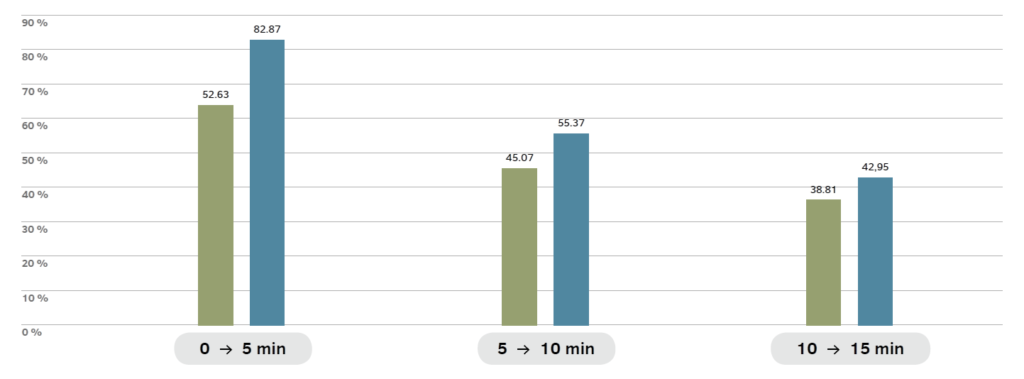
The improvements were significant in all time-to-arrival slots:
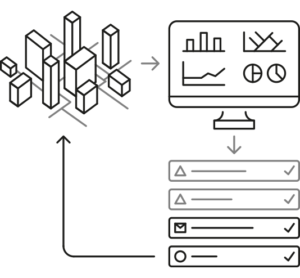
Accuracy audit data is automatically gathered, reported and stored for every element of the transit network, keeping you compliant and fully accountable.
Benchmark performance against historical data and with other cities, providing valuable insight for informed decisions on service improvements.
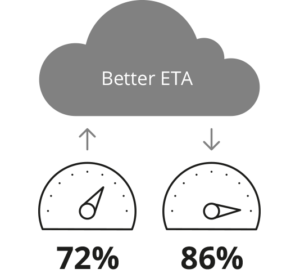
The innovative statistical engine, using progressive methods and machine learning, improves ETA by up to 30% and disseminates this data directly to your passengers in real-time, using global open data standards.
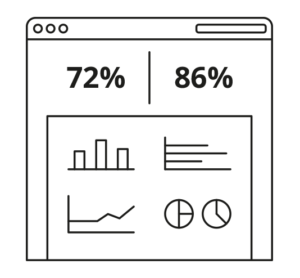
Advanced analytics dashboard gives a view of performance across a range of dimensions such as schedule adherence, travel times, headways, excess waiting times, dwell times, bus loading and to name a few.
Are you sending information to bus stops and mobile apps without any visibility of data accuracy? Are you making operational plans and decisions based on flawed data? Do you want to know to what extent you can improve your ETA predictions? Get in contact today to discuss a free benchmarking comparison.
“Working with you to improve customer experience and overall utilisation of public transport by keeping passengers more reliably informed, by helping as many service providers as possible to transition to next generation technologies”

We’re excited to tell you about the Papercast Content Management System (CMS) Layout Catalogue, an…
The REACT Trigger System is now available on Papercast displays We’re excited to share that…